XRP at a Crossroads: $2 Crash or Explosive New All-Time High? (Ripple Price Analysis)
CryptoPotato
2025-08-27 20:25:21


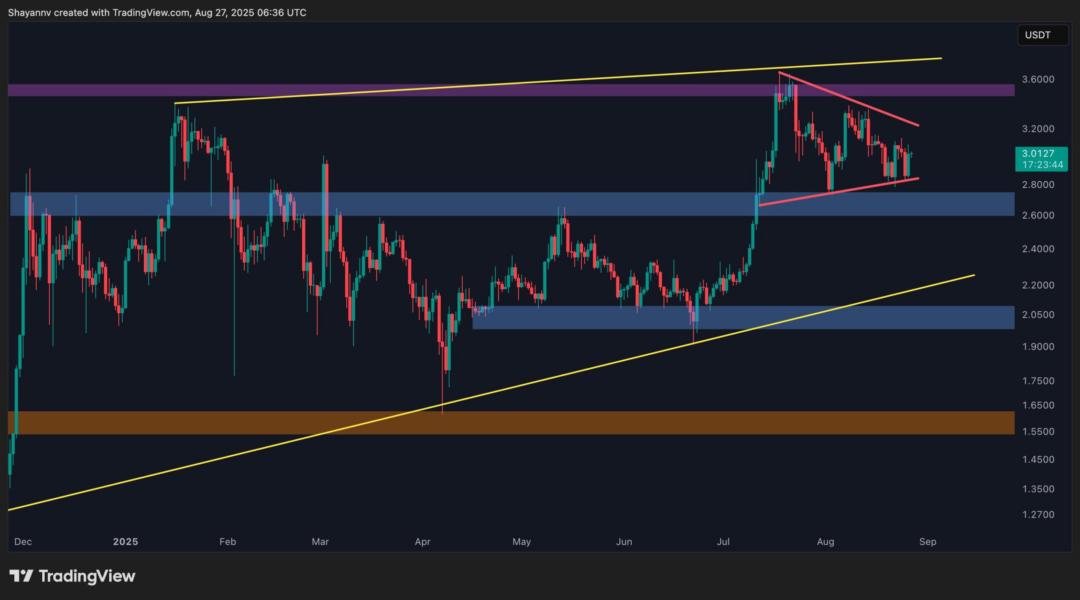
Ripple’s native cryptocurrency is currently consolidating within a triangle structure, with the $3.3 resistance acting as the key barrier for bullish continuation and $2.8 support serving as the critical floor.
The direction of the breakout from this compression will likely dictate XRP’s medium-term trajectory.XRP Price Analysis
By ShayanThe Daily Chart
On the daily chart, Ripple’s token is forming a symmetrical triangle pattern, with lower highs pressing against rising support near $2.8–$2.9. This structure reflects a period of market equilibrium as participants position for the next decisive move.
The broader bullish structure remains intact as long as price holds above the $2 demand zone, which also overlaps with the ascending wedge’s lower boundary. A breakout above $3.3 resistance would likely expose the $3.5 swing high, and potentially pave the way for a retest of the channel top near $3.7.
Conversely, a failure to defend $2.8 support could trigger a deeper correction toward the $2 zone, where the next significant demand cluster lies.
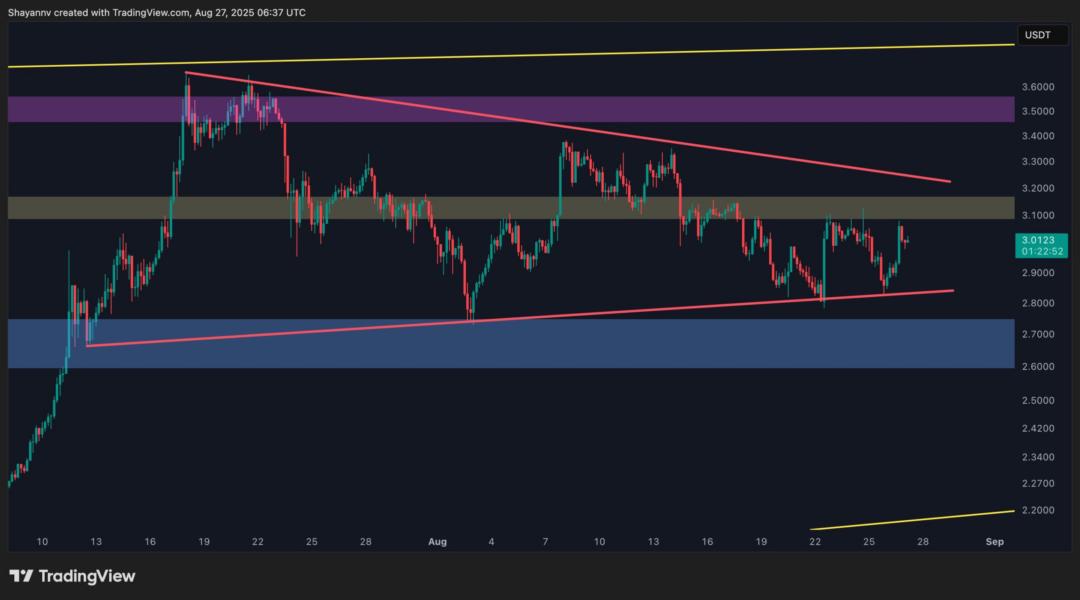
On the 4-hour timeframe, XRP continues to respect its ascending trendline support, repeatedly defending the $2.8–$2.9 zone. This has created a tightening triangle structure, consistent with ongoing consolidation.
Short-term resistance sits around $3.2, where multiple rejection wicks reveal persistent selling pressure. A clean breakout above this barrier would validate bullish momentum and open the door to $3.3–$3.5, while failure to do so may keep XRP range-bound or even trigger a drop into the $2.7 liquidity pool.
For now, Ripple’s asset remains trapped between $3.2 resistance and the dynamic ascending support trendline, awaiting a decisive breakout to establish its next directional trend.
最新快讯
ChainCatcher
2025-08-28 07:38:02
ChainCatcher
2025-08-28 06:08:39
ChainCatcher
2025-08-28 06:06:02
ChainCatcher
2025-08-28 06:03:39
ChainCatcher
2025-08-28 06:02:35